
The demographic report within your dental software is simply used to view how many patients you have in certain age ranges and the split between male and female.
To access this report, click on the tooth button in the top left hand corner of the screen and then select Reports from the menu.
Now click on the Demographic button within the patient area of the reporting screen.
After clicking the button you will be immediately displayed with the Patient Demographic window.

You can see that you have a chart which gives you a visual representation of the amount of patients for each age. The pink part of each bar represents female and the blue represents men. You also have a table which gives you the same information as the chart.
You have two different options of viewing, you can view all ages (shown above) or you can view by group. To change view simply select from the View section to the left of the table.
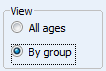
By Group allows you to view the demographic in age ranges rather than each individual age (shown below).

You can choose your age ranges by using the Groups button.
You will then be presented with the Demographic Groups window.
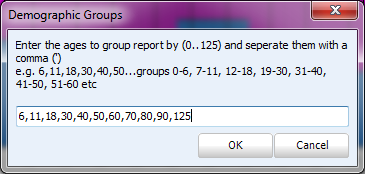
Follow the instructions then click OK to view your new date ranges.
Request a demo »