
Within your dental software you have the ability to run a Sundry report. This allows you to keep track of how many sundry items the practice has sold in a particular time period.
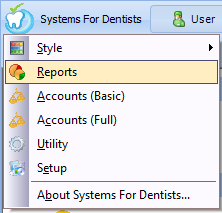
First of all click on the SFD button in top left hand corner of the screen, and then select Reports from the menu (shown below).
Click on the Sundry button to access the report.
Now you are within the Sundry report, click the New button in the top left hand corner of the screen.

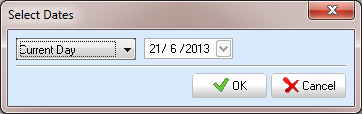
Select you date range for your report from the Select Dates window.
Your sundry items report will now be generated.
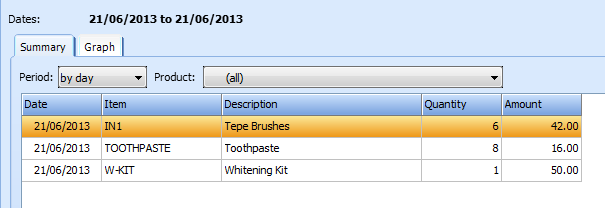
The Summary tab simply lists all sundry sales within the chosen time period followed by the quantity and the amount. View can view this list by day, week, and month or by period if you are reporting over an extended time period. Simply select the desired option from the Period dropdown list.
You can also filter your report so it only shows a particular product. Simply choose from the Product dropdown list.
The second and final tab in this report is the Graph tab. This tab produces a bar chart for a particular product within the chosen time period.
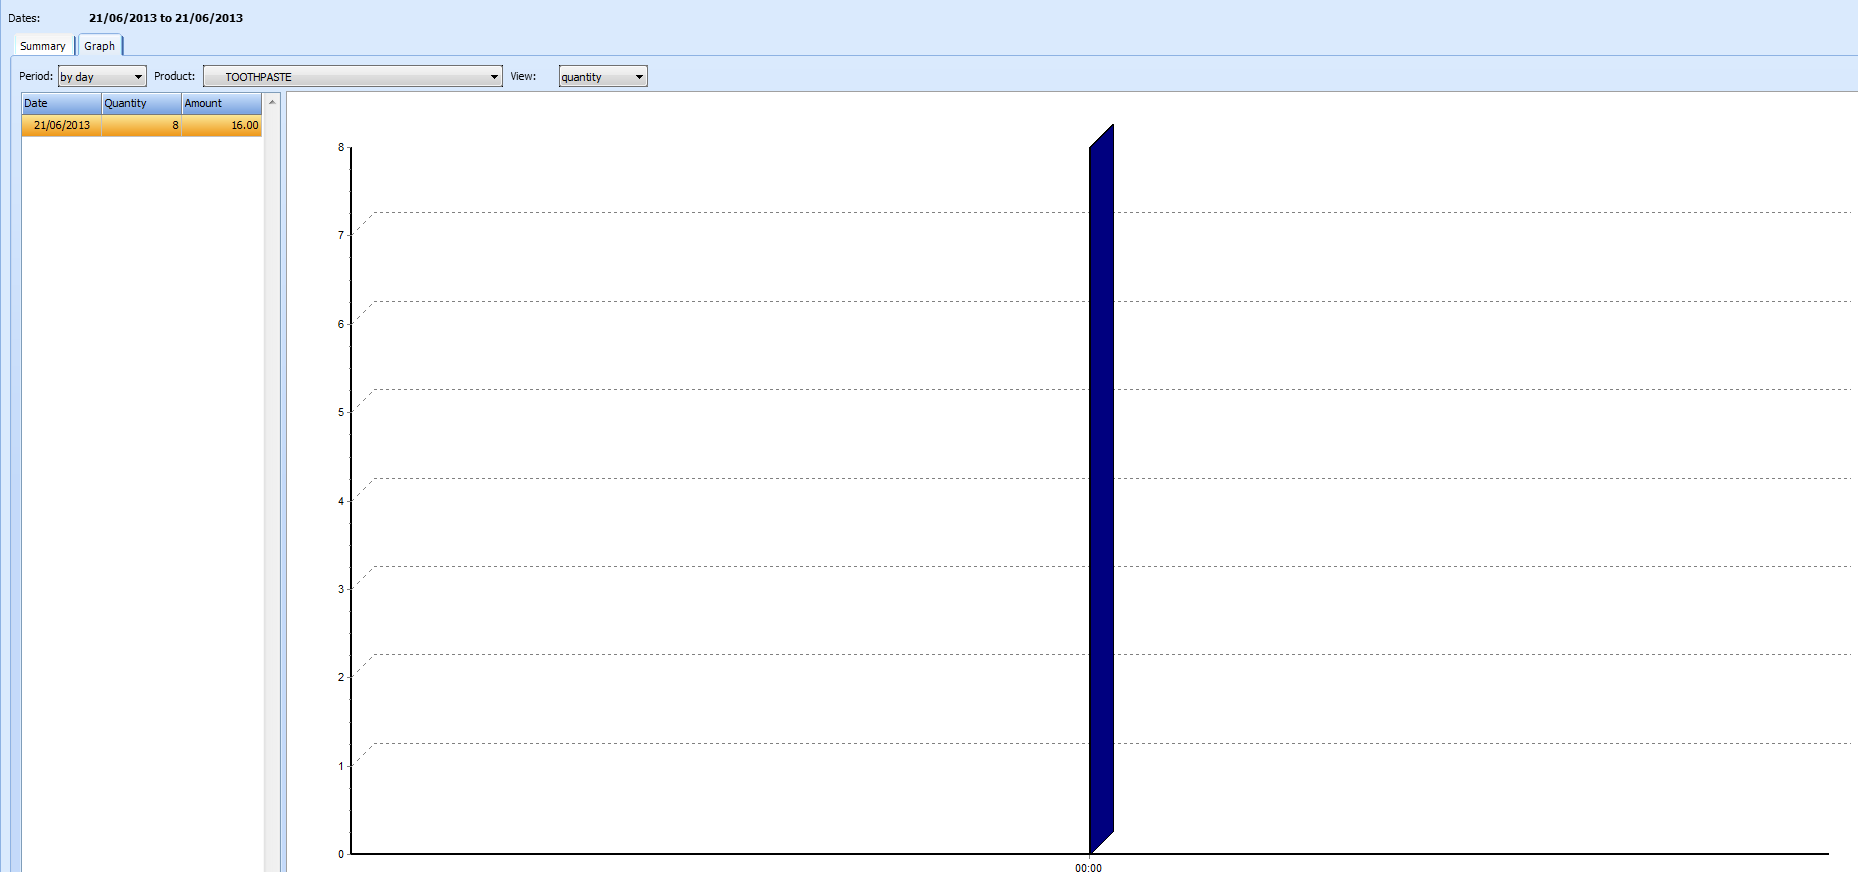
You can choose to view your chart by day, week or month (depending on the time period you are reporting against). To sleect the desired period, use the Period dropdown button. You can also choose to view by quantity or amount, use the View dropdown button to make your selection. To choose the product you wish to view, select from the Product dropdown button.
Request a demo »